
It is crucial to understand where transaction contention occurs and how it impacts your workload. Contention is a normal part of database operations. In many cases, it has limited impact on a workload. For example, a large number of contention events with a very short duration may not impact your workload. Similarly, a small number of contention events with longer duration may be acceptable if they occur outside the “user path”. However, if contention substantially contributes to query latency, it should be addressed.
This page shows how to monitor and analyze two types of contention: lock contention and serializable conflicts. These types of contention are exposed via different observability mechanisms:
The Continuous monitoring section provides further considerations on identifying when contention occurs in your workload.
The remaining sections address analyzing contention once identified:
- Analyze using
crdb_internaltables: A process to determine which workload and queries are involved in the contention. - Analysis of support scenario: An application of the previously described analysis process to a hypothetical support incident.
- Analyze using Insights page: Basic examples of lock contention are addressed.
Monitor using console
The CockroachDB Cloud Console and DB Console provide monitoring of contention using the:
Contention metrics are typically presented with count and duration information. Both lock contention and serializable conflicts will be recorded in count-related metrics, but only lock contention will be included in duration-related metrics.
SQL Statement Contention graph
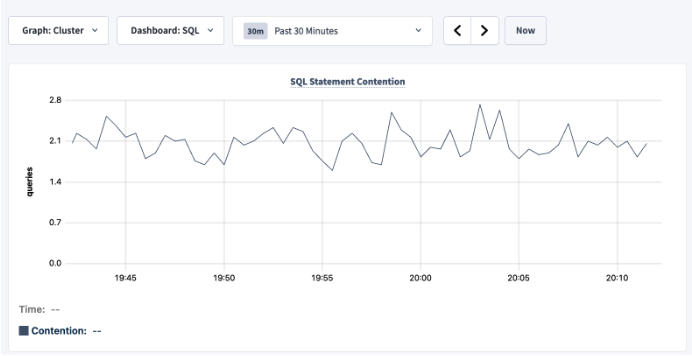
On the SQL dashboard within the Metrics page, the SQL Statement Contention graph (CockroachDB Cloud Console or DB Console) shows the rate of contention events per second across the cluster. This graph is based on the sql.distsql.contended_queries.count metric, which measures the rate of contention events per second across the cluster.
In the DB Console, in the cluster view, this rate is averaged across all nodes, which sometimes makes it difficult to interpret. When viewing an individual node, it shows the rate for that single node.
The following image from the DB Console was taken from a cluster running more than 50,000 queries per second with around 2 contention events per second. This contention is unlikely to have an impact on the workload.
SQL Activity
SQL Activity has per statement and per transaction contention information.
Statements page
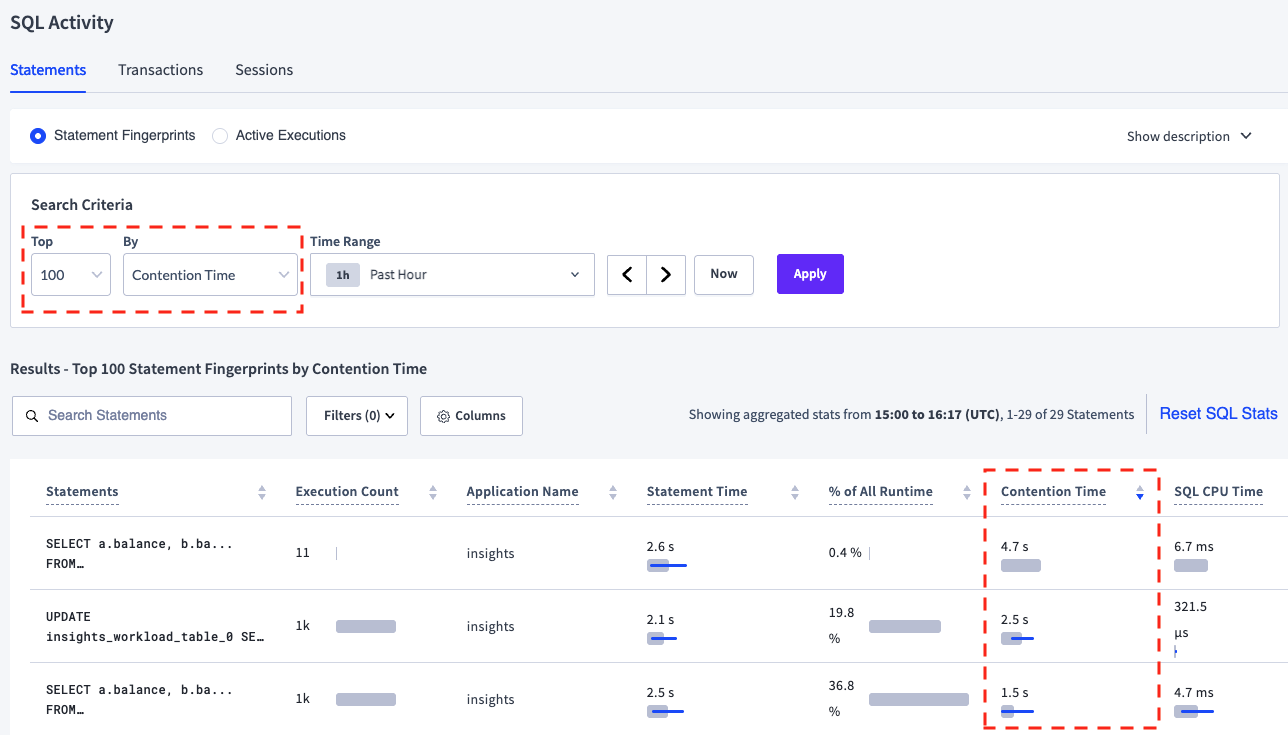
The Statements page (CockroachDB Cloud Console or DB Console) shows statements that were involved in contention events. To view these statements, change the search criteria to view the top 100 statement fingerprints by Contention Time, then sort descending by Contention Time column.
The Contention Time column displays the average time and standard deviation of contention events. As noted earlier, only lock contention events are included in the contention time.
The following image shows the Statements page with the top 3 statement fingerprints by Contention Time in a cluster containing the test data from the Analyze using crdb_internal tables section.
Transactions page
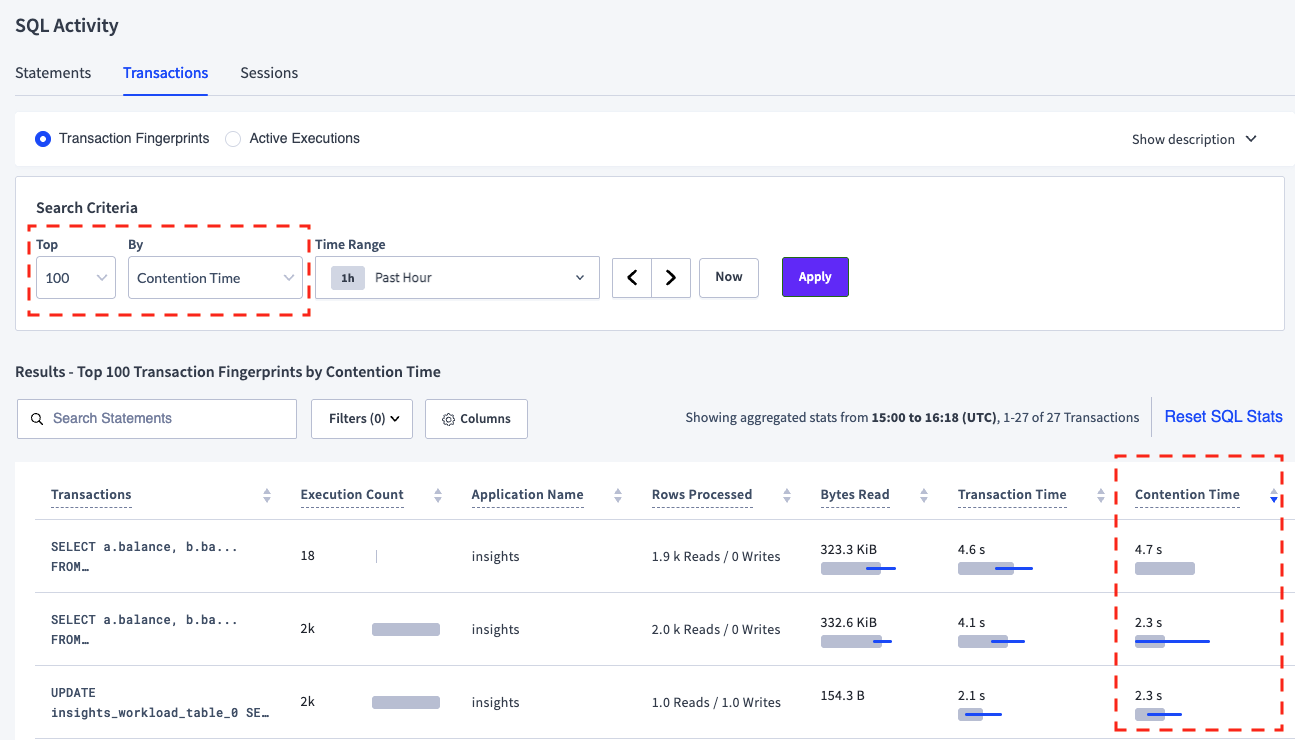
The Transactions page (CockroachDB Cloud Console or DB Console) shows transactions that were involved in contention events. To view these transactions, change the search criteria to view the top 100 transaction fingerprints by Contention Time, then sort descending by Contention Time column.
The Contention Time column displays the average and standard deviation of the time spent in contention. As noted earlier, only lock contention events are included in the contention time.
The following image shows the Transactions page with the top 3 transactions fingerprints by Contention Time in a cluster containing the test data in the Analyze using crdb_internal tables section.
Insights page
The Insights page (CockroachDB Cloud Console or DB Console) displays a variety of workload insights on statement and transaction executions related to transaction contention:
-
A statement or transaction is classified as Slow Execution if it meets either of the following criteria:
- The execution took longer than the configured
sql.insights.latency_threshold. - Anomaly detection is enabled (
sql.insights.anomaly_detection.enabled) and the execution was greater than twice the median execution latency and higher thansql.insights.anomaly_detection.latency_threshold.
- The execution took longer than the configured
-
After meeting the Slow Execution criteria, an execution is classified as High Contention if a significant portion of its duration was due to contention.
-
A statement or transaction that failed due to a serialization error is identified as a Failed Execution. If the serialization error was due to contention, there is a conflicting or blocking transaction recorded. The execution details will show the conflicting transaction.
Several workload insights settings determine how long workload insights are persisted. If clusters are generating a large number of insights, insights may only be persisted for a short period of time. The sql.insights.execution_insights_capacity setting determines the maximum number of insights stored per node, and the sql.contention.event_store.capacity setting determines the maximum storage used per node for contention events.
Monitor using metrics
As part of normal operation, CockroachDB continuously records metrics that are often useful in troubleshooting performance. The way metrics are exposed depends on the deployment type. Refer to:
- Export Metrics From a CockroachDB Standard Cluster
- Export Metrics From a CockroachDB Advanced Cluster
- Prometheus endpoint for a self-hosted cluster
The following metrics related to contention are available:
| CockroachDB Metric Name | Description | Type | Unit |
|---|---|---|---|
sql.distsql.contended_queries.count |
Number of SQL queries that experienced contention Note: Only lock contention counts are included in this metric. |
COUNTER | COUNT |
sql.distsql.cumulative_contention_nanos |
Cumulative contention across all queries (in nanoseconds) Note: Only lock contention durations are included in this metric. |
COUNTER | NANOSECOND |
txn.restarts |
Number of restarted KV transactions | HISTOGRAM | COUNT |
txn.restarts.asyncwritefailure |
Number of restarts due to async consensus writes that failed to leave intents | COUNTER | COUNT |
txn.restarts.commitdeadlineexceeded |
Number of restarts due to a transaction exceeding its deadline | COUNTER | COUNT |
txn.restarts.readwithinuncertainty |
Number of restarts due to reading a new value within the uncertainty interval | COUNTER | COUNT |
txn.restarts.serializable |
Number of restarts due to a forwarded commit timestamp and isolation=SERIALIZABLE | COUNTER | COUNT |
txn.restarts.txnaborted |
Number of restarts due to an abort by a concurrent transaction (usually due to deadlock) | COUNTER | COUNT |
txn.restarts.txnpush |
Number of restarts due to a transaction push failure | COUNTER | COUNT |
txn.restarts.unknown |
Number of restarts due to a unknown reasons | COUNTER | COUNT |
txn.restarts.writetooold |
Number of restarts due to a concurrent writer committing first | COUNTER | COUNT |
Since these metrics are not categorized by database, interpreting them can be challenging.
Monitor using crdb_internal tables
The crdb_internal system catalog is a schema that contains information about internal objects, processes, and metrics related to a specific database. crdb_internal tables are read-only.
transaction_contention_events table
The crdb_internal.transaction_contention_events virtual table contains information about historical transaction contention events. By default, lock contention events and serializable conflicts with a blocking transaction are stored in memory on each node and exposed via SQL in this virtual table.
Querying crdb_internal.transaction_contention_events triggers RPCs to every node, making it a resource-intensive operation. Avoid frequent polling to minimize resource usage.
Several cluster settings control how events are logged to this table. In most cases, the default settings are sufficient.
| Setting | Type | Default | Description |
|---|---|---|---|
sql.contention.event_store.capacity |
byte size | 64 MiB |
the in-memory storage capacity per-node of contention event store |
sql.contention.event_store.duration_threshold |
duration | 0s |
minimum contention duration to cause the contention events to be collected into crdb_internal.transaction_contention_events. If 0, always store. |
sql.contention.event_store.resolution_interval |
duration | 30s |
the interval at which transaction fingerprint ID resolution is performed (set to 0 to disable) |
sql.contention.record_serialization_conflicts.enabled |
boolean | true |
enables recording 40001 errors with conflicting txn meta as SERIALIZATION_CONFLICT contention events into crdb_internal.transaction_contention_events |
crdb_internal.transaction_content_events displays in-memory data, not on-disk data. The data changes over time as new events arrive and old ones are evicted from the cache.
The table columns are as follows:
| Column | Type | Description |
|---|---|---|
collection_ts |
TIMESTAMPTZ NOT NULL |
The timestamp when the transaction contention event was collected. |
blocking_txn_id |
UUID NOT NULL |
The ID of the blocking transaction. You can join this column into the cluster_contention_events table. |
blocking_txn_fingerprint_id |
BYTES NOT NULL |
The ID of the blocking transaction fingerprint. To surface historical information about the transactions that caused the contention, you can join this column into the statement_statistics and transaction_statistics tables. |
waiting_txn_id |
UUID NOT NULL |
The ID of the waiting transaction. You can join this column into the cluster_contention_events table. |
waiting_txn_fingerprint_id |
BYTES NOT NULL |
The ID of the waiting transaction fingerprint. To surface historical information about the transactions that caused the contention, you can join this column into the statement_statistics and transaction_statistics tables. |
waiting_stmt_id |
STRING NOT NULL |
The statement id of the transaction that was waiting (unique for each statement execution). |
waiting_stmt_fingerprint_id |
BYTES NOT NULL |
The ID of the waiting statement fingerprint. To surface historical information about the statements that caused the contention, you can join this column into the statement_statistics table. |
contention_duration |
INTERVAL NOT NULL |
The interval of time the waiting transaction spent waiting for the blocking transaction. |
contending_key |
BYTES NOT NULL |
The key on which the transactions contended. |
contending_pretty_key |
STRING NOT NULL |
The specific key that was involved in the contention event, in readable format. |
database_name |
STRING NOT NULL |
The database where the contention occurred. |
schema_name |
STRING NOT NULL |
The schema where the contention occurred. |
table_name |
STRING NOT NULL |
The table where the contention occurred. |
index_name |
STRING NULL |
The index where the contention occurred. |
contention_type |
STRING NOT NULL |
The type of contention. Possible values:
contention_type is not modified. A transaction may have multiple LOCK_WAIT events, as they correspond to specific keys, but only one SERIALIZATION_CONFLICT event. |
The transaction and statement fingerprint IDs (*_txn_fingerprint_id and *_stmt_fingerprint_id) columns are hexadecimal values that can be used to look up the SQL and other information from the crdb_internal.transaction_statistics and crdb_internal.statement_statistics tables. These should not be confused with the transaction and statement IDs (*_txn_id and *_stmt_id), which are unique for each transaction and statement execution.
The crdb_internal.transaction_contention_events table can be used to summarize the frequency and duration of contention events by database, schema, table and index. This can be useful for determining which workloads have the highest frequency and duration of contention events and which indexes they are occurring on. The table includes details on specific transactions and statements involved in contention, enabling deeper analysis.
Other tables
There are several other tables that can give insights into contention.
crdb_internal.cluster_contended_indexescrdb_internal.cluster_contended_tablescrdb_internal.cluster_contended_keysThese are views based on
crdb_internal.transaction_contention_eventsthat group all events by index, table, and key, respectively. A start and end time cannot be provided, so they count every event that is currently stored. As a result, these act more like counter metrics, which can be misleading since high values do not always indicate a high contention rate.-
This is a virtual table that contains information about locks held by transactions on specific keys. It only shows this information for locks held at the time the table is queried.
Warning:Similar to
crdb_internal.transaction_contention_events,crdb_internal.cluster_lockstriggers an RPC fan out to all nodes in the cluster to capture this information, so it can be a relatively expensive operation to query it.
Continuous monitoring
CockroachDB offers tools to monitor contention, but it is important to turn this data into actionable insights. The main question is: “Does contention significantly affect this workload?” Ideally, continuous monitoring should answer this without manual effort.
At the cluster level, track how often contention happens compared to overall throughput. For example, divide the rate of contention events (sql.distsql.contended_queries.count metric) by the total number of queries (sql.query.count metric) to get the percentage of queries affected by contention. This provides a high-level indicator of how frequently contention occurs but does not identify specific workloads.
If contention affects more than 1% of queries, use the crdb_internal table analysis to identify the impacted workloads and queries.
Because querying the crdb_internal.transaction_contention_events table requires an expensive RPC fan-out, it is not recommended for use as a part of a continuous monitoring system.
Analyze using crdb_internal tables
To analyze contention causes, use crdb_internal.transaction_contention_events, crdb_internal.transaction_statistics and crdb_internal.statement_statistics tables.
First, retrieve the frequency and duration of contention events for a specific time period. These can be summarized at a database, schema, table, and index level to make it easy to identify if any workload has significant lock contention. Since some contention is expected, compare the frequency and duration of contention events against overall workload volume to assess the impact.
Next, individual transactions and statements can be analyzed to understand the specific causes and impacts of the contention. The transaction and statement fingerprints can be used to look up detailed information from the crdb_internal.transaction_statistics and crdb_internal.statement_statistics tables, such as the specific SQL.
Run insights workload
Use two terminals to analyze contention in the sample insights workload.
In Terminal 1, use the
cockroach democommand to start a temporary, in-memory CockroachDB cluster of one node. Once the cluster is started, an interactive SQL shell will connect to that cluster. This shell will be used in the analysis process.cockroach demo --no-example-database --insecureIn Terminal 2, use cockroach workload to load the initial schema on the demo cluster:
cockroach workload init insights 'postgresql://root@localhost:26257?sslmode=disable'Then, run the workload for 10 minutes:
cockroach workload run insights --concurrency=128 --duration=10m 'postgresql://root@localhost:26257?sslmode=disable'You'll see per-operation statistics print to standard output every second:
_elapsed___errors__ops/sec(inst)___ops/sec(cum)__p50(ms)__p95(ms)__p99(ms)_pMax(ms)
    1.0s        0            4.0            4.0     25.2     60.8     60.8     60.8 joinOnNonIndexColumn
    1.0s        0          127.7          127.8     39.8     71.3     79.7     79.7 orderByOnNonIndexColumn
    1.0s        0          127.7          127.8     62.9     75.5     83.9     83.9 transfer
    2.0s        0            0.5            0.5    973.1    973.1    973.1    973.1 contention
    ...
After the specified duration (10 minutes in this case), the workload will stop and you'll see totals printed to standard output:
_elapsed___errors_____ops(total)___ops/sec(cum)__avg(ms)__p50(ms)__p95(ms)__p99(ms)_pMax(ms)__result
  600.0s        0          23739           39.6   3226.8   3758.1   6174.0   7784.6  12884.9
In the interactive SQL shell in Terminal 1, run the SQL queries in this test scenario.
transaction_contention_events
Query 1 time period
When analyzing contention in a workload, you need the time period when it occurred. For this test scenario, get the time period of contention events by finding the min and max of the collection_ts column. Adjust Query 2 and Query 3 with this time period clause.
SELECT CONCAT('BETWEEN ''',MIN(collection_ts),''' AND ''', MAX(collection_ts),'''') FROM crdb_internal.transaction_contention_events;
                                    concat
-------------------------------------------------------------------------------
  BETWEEN '2025-02-18 20:16:18.906348+00' AND '2025-02-18 20:56:25.030577+00'
Query 2 frequency and duration
Find the frequency, total duration, and average duration of contention events per database, schema, table, and index for the test time period. Internal contention events (e.g., to system tables) are excluded by omitting the fingerprints with the pattern '0000000000000000'.
SELECT COUNT(*) as cnt,
  SUM(contention_duration) as duration,
  SUM(contention_duration)/count(*) as avg_duration,
  database_name, schema_name, table_name, index_name, contention_type
FROM crdb_internal.transaction_contention_events
WHERE collection_ts BETWEEN '2025-02-18 20:16:18.906348+00' AND '2025-02-18 20:56:25.030577+00'
  AND encode(blocking_txn_fingerprint_id, 'hex') != '0000000000000000'
  AND encode(waiting_txn_fingerprint_id, 'hex') != '0000000000000000'
GROUP BY database_name, schema_name, table_name, index_name, contention_type
ORDER BY COUNT(*) desc;
  cnt  |    duration     |  avg_duration   | database_name | schema_name |        table_name         |           index_name           | contention_type
-------+-----------------+-----------------+---------------+-------------+---------------------------+--------------------------------+------------------
  1281 | 00:11:37.329786 | 00:00:00.544364 | insights      | public      | insights_workload_table_0 | insights_workload_table_0_pkey | LOCK_WAIT
   157 | 00:04:32.919447 | 00:00:01.73834  | insights      | public      | insights_workload_table_1 | insights_workload_table_1_pkey | LOCK_WAIT
These results show that the primary key insights_workload_table_0_pkey had 1281 contention events in the time period with a total duration of 11m37.3s and an average duration of 544ms.
Query 3 blocking and waiting transaction fingerprint IDs
To find the top 2 combinations of blocking transaction and waiting transactions and statements, modify the previous query by:
- Grouping by
blocking_txn_fingerprint_id, waiting_txn_fingerprint_id,waiting_stmt_fingerprint_id. - Filtering by
database_name,table_name, andindex_name. - Then, placing the resulting query in a common table expression (CTE).
With x AS (
SELECT COUNT(*) AS cnt,
  SUM(contention_duration) as duration,
  SUM(contention_duration)/count(*) as avg_duration,
  blocking_txn_fingerprint_id, waiting_txn_fingerprint_id, waiting_stmt_fingerprint_id,
  database_name, schema_name, table_name, index_name, contention_type
FROM crdb_internal.transaction_contention_events
WHERE collection_ts BETWEEN '2025-02-18 20:16:18.906348+00' AND '2025-02-18 20:56:25.030577+00'
  AND encode(blocking_txn_fingerprint_id, 'hex') != '0000000000000000'
  AND encode(waiting_txn_fingerprint_id, 'hex') != '0000000000000000'
  AND database_name = 'insights' AND table_name = 'insights_workload_table_0' AND index_name = 'insights_workload_table_0_pkey'
GROUP BY blocking_txn_fingerprint_id, waiting_txn_fingerprint_id, waiting_stmt_fingerprint_id, database_name, schema_name, table_name, index_name, contention_type
)
SELECT row_number() OVER (), *
  FROM (
        SELECT cnt, blocking_txn_fingerprint_id, waiting_txn_fingerprint_id, waiting_stmt_fingerprint_id
        FROM x ORDER BY cnt DESC LIMIT 2
  );
  row_number | cnt | blocking_txn_fingerprint_id | waiting_txn_fingerprint_id | waiting_stmt_fingerprint_id
-------------+-----+-----------------------------+----------------------------+------------------------------
           1 | 551 | \xebdfe9282ddfd5bd          | \x275ef4f9eea20099         | \x883d49b568a3b746
           2 | 288 | \x966b8907aeed74ec          | \x9df582e8f8802926         | \x32963fa47e819ef9
transaction_statistics
Query 4 blocking statement fingerprint IDs
To get the statements associated with the blocking transaction (\xebdfe9282ddfd5bd) from row_number 1, we can query the crdb_internal.transaction_statistics table:
SELECT fingerprint_id as blocking_txn_fingerprint_id, app_name, metadata->>'stmtFingerprintIDs' AS blocking_stmt_fingerprint_ids
FROM crdb_internal.transaction_statistics
WHERE fingerprint_id = '\xebdfe9282ddfd5bd' LIMIT 1;
  blocking_txn_fingerprint_id | app_name |                blocking_stmt_fingerprint_ids
------------------------------+----------+---------------------------------------------------------------
  \xebdfe9282ddfd5bd          | insights | ["4bb36019649a9816", "47778d05a0e698a4", "845cbd5dab02f860"]
statement_statistics
Query 5 blocking statement SQL
To get the SQL associated with the blocking statements, query the crdb_internal.statement_statistics table using the fingerprint IDs previously found.
SELECT fingerprint_id as blocking_stmt_fingerprint_id, app_name, metadata->>'query' AS query
FROM crdb_internal.statement_statistics
WHERE transaction_fingerprint_id='\xebdfe9282ddfd5bd' and fingerprint_id in ('\x4bb36019649a9816','\x47778d05a0e698a4','\x845cbd5dab02f860')
ORDER BY fingerprint_id
  blocking_stmt_fingerprint_id | app_name |                                  query
-------------------------------+----------+--------------------------------------------------------------------------
  \x47778d05a0e698a4           | insights | SELECT pg_sleep(_)
  \x4bb36019649a9816           | insights | UPDATE insights_workload_table_0 SET balance = balance - _ WHERE id = _
  \x845cbd5dab02f860           | insights | UPDATE insights_workload_table_0 SET balance = balance + _ WHERE id = _
Query 6 waiting statement SQL
To get the SQL associated with the waiting statement (\x883d49b568a3b746 of transaction \x275ef4f9eea20099), again query the crdb_internal.statement_statistics table.
SELECT fingerprint_id as waiting_stmt_fingerprint_id, app_name, metadata->>'query' AS query
FROM crdb_internal.statement_statistics
WHERE transaction_fingerprint_id='\x275ef4f9eea20099' and fingerprint_id = '\x883d49b568a3b746'
  waiting_stmt_fingerprint_id | app_name |                                    query
------------------------------+----------+------------------------------------------------------------------------------
  \x883d49b568a3b746          | insights | SELECT balance FROM insights_workload_table_0 ORDER BY balance DESC LIMIT _
A similar process can be applied to the second set (row_number 2) of blocking and waiting transactions and statements.
This process provides a view of the actual statements that are involved in the highest frequency of contention events.
Analysis of support scenario
This section applies a variation of the previously described analysis process to a hypothetical support scenario where high contention occurred during a period of increased errors.
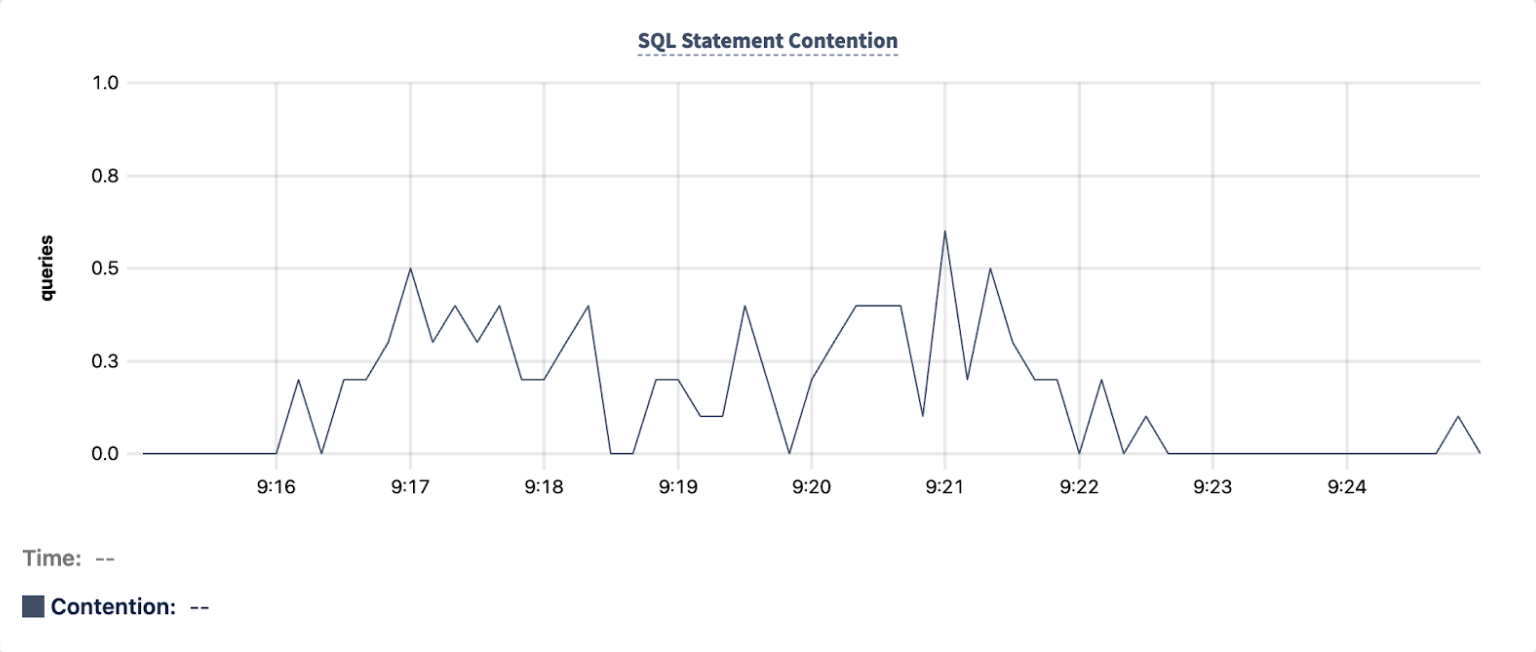
Review the DB Console Metrics graphs to get a high-level understanding of the contention events. The SQL Statement Errors graph show an increase of errors during the time period of 9:16 to 9:23 UTC:
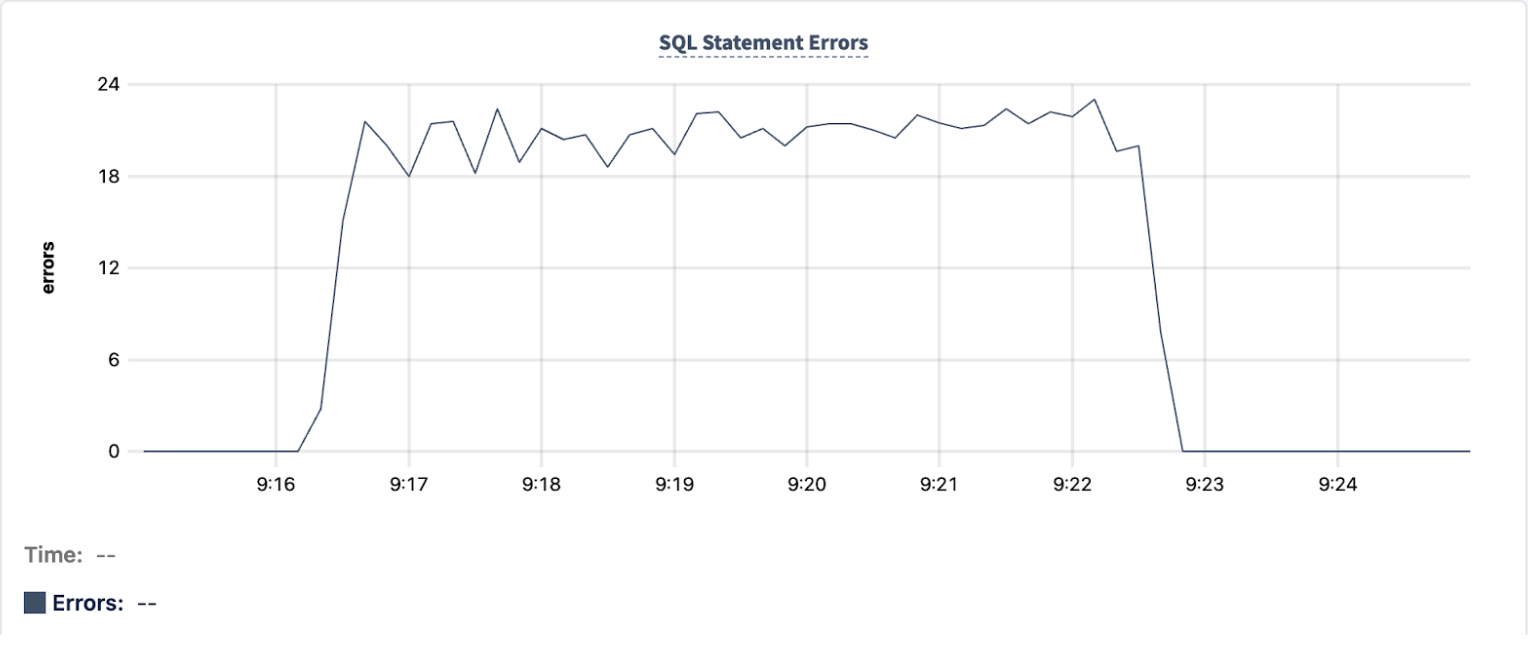
The SQL Statement Contention graph shows a corresponding increase between 9:16 and 9:23 UTC:
The Transaction Restarts graph also shows a corresponding increase between 9:16 and 9:23 UTC:
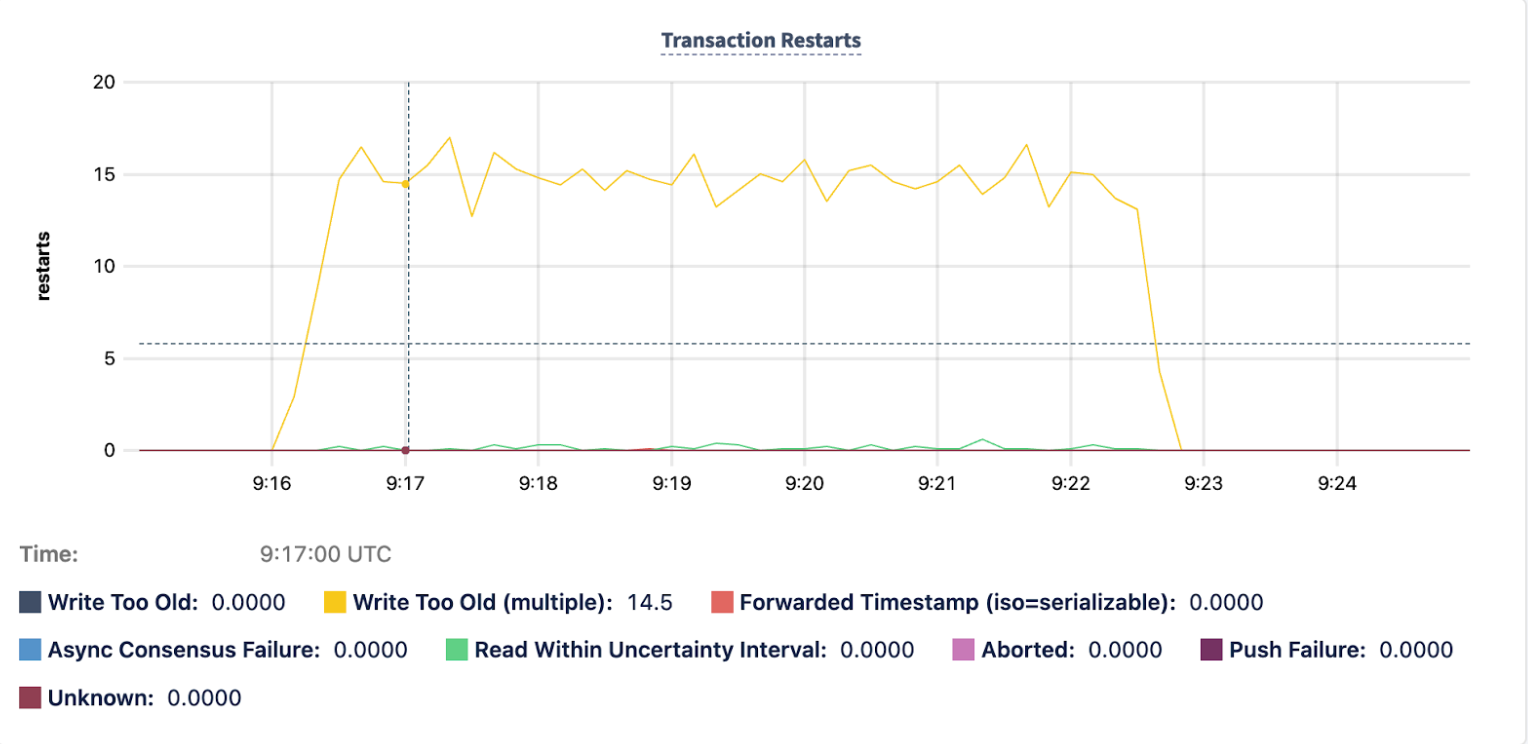
These graphs help to understand the incident at a high-level, but not the specific transactions that are involved. To understand that, query crdb_internal.transaction_contention_events table.
transaction_contention_events for support scenario
Query 1 frequency and duration
Determine the frequency, total duration, and average duration of contention events per database, schema, table, and index for the time period. Internal contention events (e.g., to system tables) are excluded by omitting the fingerprints with the pattern '0000000000000000'.
SELECT COUNT(*) as cnt,
  SUM(contention_duration) as duration,
  SUM(contention_duration)/count(*) as avg_duration,
  database_name, schema_name, table_name, index_name, contention_type
FROM crdb_internal.transaction_contention_events
WHERE collection_ts BETWEEN '2025-02-20 09:16:00' AND '2025-02-20 09:23:00'
  AND encode(blocking_txn_fingerprint_id, 'hex') != '0000000000000000'
  AND encode(waiting_txn_fingerprint_id, 'hex') != '0000000000000000'
GROUP BY database_name, schema_name, table_name, index_name, contention_type
ORDER BY COUNT(*) desc;
  cnt  |    duration     |  avg_duration   | database_name       | schema_name | table_name  | index_name          | contention_type
-------+-----------------+-----------------+---------------------+-------------+-------------+---------------------+------------------------
  4756 | ...             | ...             | Support-permissions | public      | UserOptions | UserOptions+userKey | SERIALIZATION_CONFLICT
     8 | ...             | ...             | Support-permissions | public      | UserOptions | UserOptions+id      | SERIALIZATION_CONFLICT
The results indicate that the main source of the contention is the UserOptions+userKey index on the UserOptions table.
Examine the table schema for UserOptions. Notice that the UserOptions+userKey index is a secondary unique index on the userKey column.
SHOW CREATE UserOptions;
  table_name | create_statement
-------------+-------------------------------------------------------------
"UserOptions"| CREATE TABLE public."UserOptions" (
             |     id INT8 NOT NULL DEFAULT unordered_unique_rowid(),
             |     "updatedUtc" INT8 NOT NULL,
             |     "userKey" STRING(40) NOT NULL,
             |     ...
             |     CONSTRAINT "UserOptions+id" PRIMARY KEY (id ASC),
             |     UNIQUE INDEX "UserOptions+userKey" ("userKey" ASC),
             |     ...
             | )
Query 2 specific contending_key
Determine which specific keys were involved in the contention events on that index:
SELECT contending_key, crdb_internal.pretty_key(contending_key, 0) as pretty_key, count(*)
FROM crdb_internal.transaction_contention_events
WHERE collection_ts BETWEEN '2025-02-20 09:16:00' AND '2025-02-20 09:23:00'
  AND database_name = 'Support-permissions' AND table_name = 'UserOptions' AND index_name = 'UserOptions+userKey'
GROUP BY contending_key, crdb_internal.pretty_key(contending_key, 0)
ORDER BY count(*) DESC;

                contending_key                |        pretty_key         | count
-----------------------------------------------+---------------------------+--------
  \xf67f8a123739635a316b6a64316f303d2d31000188 | /127/2/"abcdefghijklmn"/0 |  4756
The results indicate that a single key ("abcdefghijklmn") accounts for all of the contention events during the incident time period.
Query 3 blocking and waiting transaction fingerprint IDs
Next, determine which specific transactions and statements were involved in the contention events. Modify the query by updating the database_name, table_name, and index_name. Increase the limit to 5.
With x AS (
SELECT COUNT(*) AS cnt,
  SUM(contention_duration) as duration,
  SUM(contention_duration)/count(*) as avg_duration,
  blocking_txn_fingerprint_id, waiting_txn_fingerprint_id, waiting_stmt_fingerprint_id,
  database_name, schema_name, table_name, index_name, contention_type
FROM crdb_internal.transaction_contention_events
WHERE collection_ts BETWEEN '2025-02-20 09:16:00' AND '2025-02-20 09:23:00'
  AND encode(blocking_txn_fingerprint_id, 'hex') != '0000000000000000'
  AND encode(waiting_txn_fingerprint_id, 'hex') != '0000000000000000'
  AND database_name = 'Support-permissions' AND table_name = 'UserOptions' AND index_name = 'UserOptions+userKey'
GROUP BY blocking_txn_fingerprint_id, waiting_txn_fingerprint_id, waiting_stmt_fingerprint_id, database_name, schema_name, table_name, index_name, contention_type
)
SELECT row_number() OVER (), *
  FROM (
        SELECT cnt, blocking_txn_fingerprint_id, waiting_txn_fingerprint_id, waiting_stmt_fingerprint_id
        FROM x ORDER BY cnt DESC LIMIT 5
  );
  row_number | cnt  | blocking_txn_fingerprint_id | waiting_txn_fingerprint_id | waiting_stmt_fingerprint_id
-------------+------+-----------------------------+----------------------------+------------------------------
           1 | 1331 | \x9b06dfa27c208be3          | \x9b06dfa27c208be3         | \x346562eefa213c3c
           2 | 1164 | \x9b06f0a27c20af50          | \x9b06dfa27c208be3         | \x346562eefa213c3c
           3 | 1115 | \x9b06dfa27c208be3          | \x9b06f0a27c20af50         | \x346562eefa213c3c
           4 |  968 | \x9b06f0a27c20af50          | \x9b06f0a27c20af50         | \x346562eefa213c3c
           5 |   52 | \xcbf29ce484222325          | \x9b06dfa27c208be3         | \x346562eefa213c3c
The results indicate that the top 4 rows, which accounted for the vast majority of the contention events, all involved two blocking transaction fingerprints: \x9b06dfa27c208be3 and \x9b06f0a27c20af50. There is a single statement fingerprint that does all of the waiting: \x346562eefa213c3c.
transaction_statistics and statement_statistics
To examine the statements associated with the two transaction fingerprints, query the crdb_internal.transaction_statistics and crdb_internal.statement_statistics tables.
Query 4 row 1 blocking statement fingerprint IDs
SELECT fingerprint_id as blocking_txn_fingerprint_id, app_name, metadata->>'stmtFingerprintIDs' AS blocking_stmt_fingerprint_ids
FROM crdb_internal.transaction_statistics
WHERE fingerprint_id = '\x9b06dfa27c208be3' LIMIT 1;
  blocking_txn_fingerprint_id | app_name        | blocking_stmt_fingerprint_ids
------------------------------+-----------------+-------------------------------
  \x9b06dfa27c208be3          | permissions-api | ["346562eefa213c3c"]
Query 5 row 1 blocking statement metadata
Instead of selecting the metadata->>'query' key as in Query 5 blocking statement SQL, select the whole JSONB metadata object.
SELECT fingerprint_id as blocking_stmt_fingerprint_id, app_name, jsonb_pretty(metadata) AS metadata
FROM crdb_internal.statement_statistics
WHERE transaction_fingerprint_id='\x9b06dfa27c208be3' and fingerprint_id in ('\x346562eefa213c3c')
ORDER BY fingerprint_id;
    fingerprint_id   |       app_name        | metadata
---------------------+-----------------------+------------------------------------------------------------------------------------------------------------------------------------------------------------------------------
  \x346562eefa213c3c | permissions-api       | {
                     |                       |     "db": "Support-permissions",
                     |                       |     "distsql": false,
                     |                       |     "failed": true,
                     |                       |     "fullScan": false,
                     |                       |     "implicitTxn": true,
                     |                       |     "query": "INSERT INTO \"UserOptions\"(\"userKey\", \"updatedUtc\") VALUES ($1, $1) ON CONFLICT (\"userKey\") DO UPDATE SET \"updatedUtc\" = excluded.\"updatedUtc\" ...
                     |                       |     "querySummary": "INSERT INTO \"UserOptions\".(\"userKey\", \"updatedUtc\")",
                     |                       |     "stmtType": "TypeDML",
                     |                       |     "vec": false
                     |                       | }
Note that in metadata, the key "failed" has the value of true.
Query 6 row 2 blocking statement fingerprint IDs
SELECT fingerprint_id as blocking_txn_fingerprint_id, app_name, metadata->>'stmtFingerprintIDs' AS blocking_stmt_fingerprint_ids
FROM crdb_internal.transaction_statistics
WHERE fingerprint_id = '\x9b06f0a27c20af50' LIMIT 1;
  blocking_txn_fingerprint_id | app_name        | blocking_stmt_fingerprint_ids
------------------------------+-----------------+-------------------------------
  \x9b06f0a27c20af50          | permissions-api | ["x34654deefa21188f"]
Query 7 row 2 blocking statement metadata
SELECT fingerprint_id as blocking_stmt_fingerprint_id, app_name, jsonb_pretty(metadata) AS metadata
FROM crdb_internal.statement_statistics
WHERE transaction_fingerprint_id='\x9b06f0a27c20af50' and fingerprint_id in ('\x34654deefa21188f')
ORDER BY fingerprint_id;
    fingerprint_id   |       app_name        | metadata
---------------------+-----------------------+--------------------------------------------------------------------------------------------------------------------------------------------------------------------------------------------------------------------------------------------------------------------------------------------------------------------------------------------------------------------------------------------------------------------------------------------------------------------------------------------------------------------------------------------------------------------------------------------------------------------------------------------------------------------------------------------------------------------------------------
  \x34654deefa21188f | permissions-api       | {
                     |                       |     "db": "Support-permissions",
                     |                       |     "distsql": false,
                     |                       |     "failed": false,
                     |                       |     "fullScan": false,
                     |                       |     "implicitTxn": true,
                     |                       |     "query": "INSERT INTO \"UserOptions\"(\"userKey\", \"updatedUtc\") VALUES ($1, $1) ON CONFLICT (\"userKey\") DO UPDATE SET \"updatedUtc\" = excluded.\"updatedUtc\" ...
                     |                       |     "querySummary": "INSERT INTO \"UserOptions\".(\"userKey\", \"updatedUtc\")",
                     |                       |     "stmtType": "TypeDML",
                     |                       |     "vec": false
                     |                       | }
Note that in metadata, the key "failed" has the value of false.
Transactions from row 1 and row 2 are both the INSERT or UPDATE operations with the first having failed executions ("failed": true) and the second successful ("failed": false).
From this analysis, we can conclude that a large number of INSERT or UPDATE operations were operating on the same userKey ("abcdefghijklmn") in the UserOptions@UserOptions+userKey index during the time period of the incident.
The next steps would be to investigate what on the application side may have caused this large number of updates on a single key.
Analyze using Insights page
While the previous analysis process uses the crdb_internal tables, the performance tuning tutorial Troubleshoot Lock Contention gives basic examples to understand lock contention and how to analyze it using the Insights page.
See Also
- Transaction contention best practices
- Transaction contention performance tuning recipe
- Troubleshoot Lock Contention
- SQL Dashboard (DB Console) or SQL metrics (Cloud Console)
- Statements page (CockroachDB Cloud Console or DB Console)
- Transactions page (CockroachDB Cloud Console or DB Console)
- Insights page (CockroachDB Cloud Console or DB Console)
crdb_internal
Was this helpful?